ORCHARD DATA REPORTS
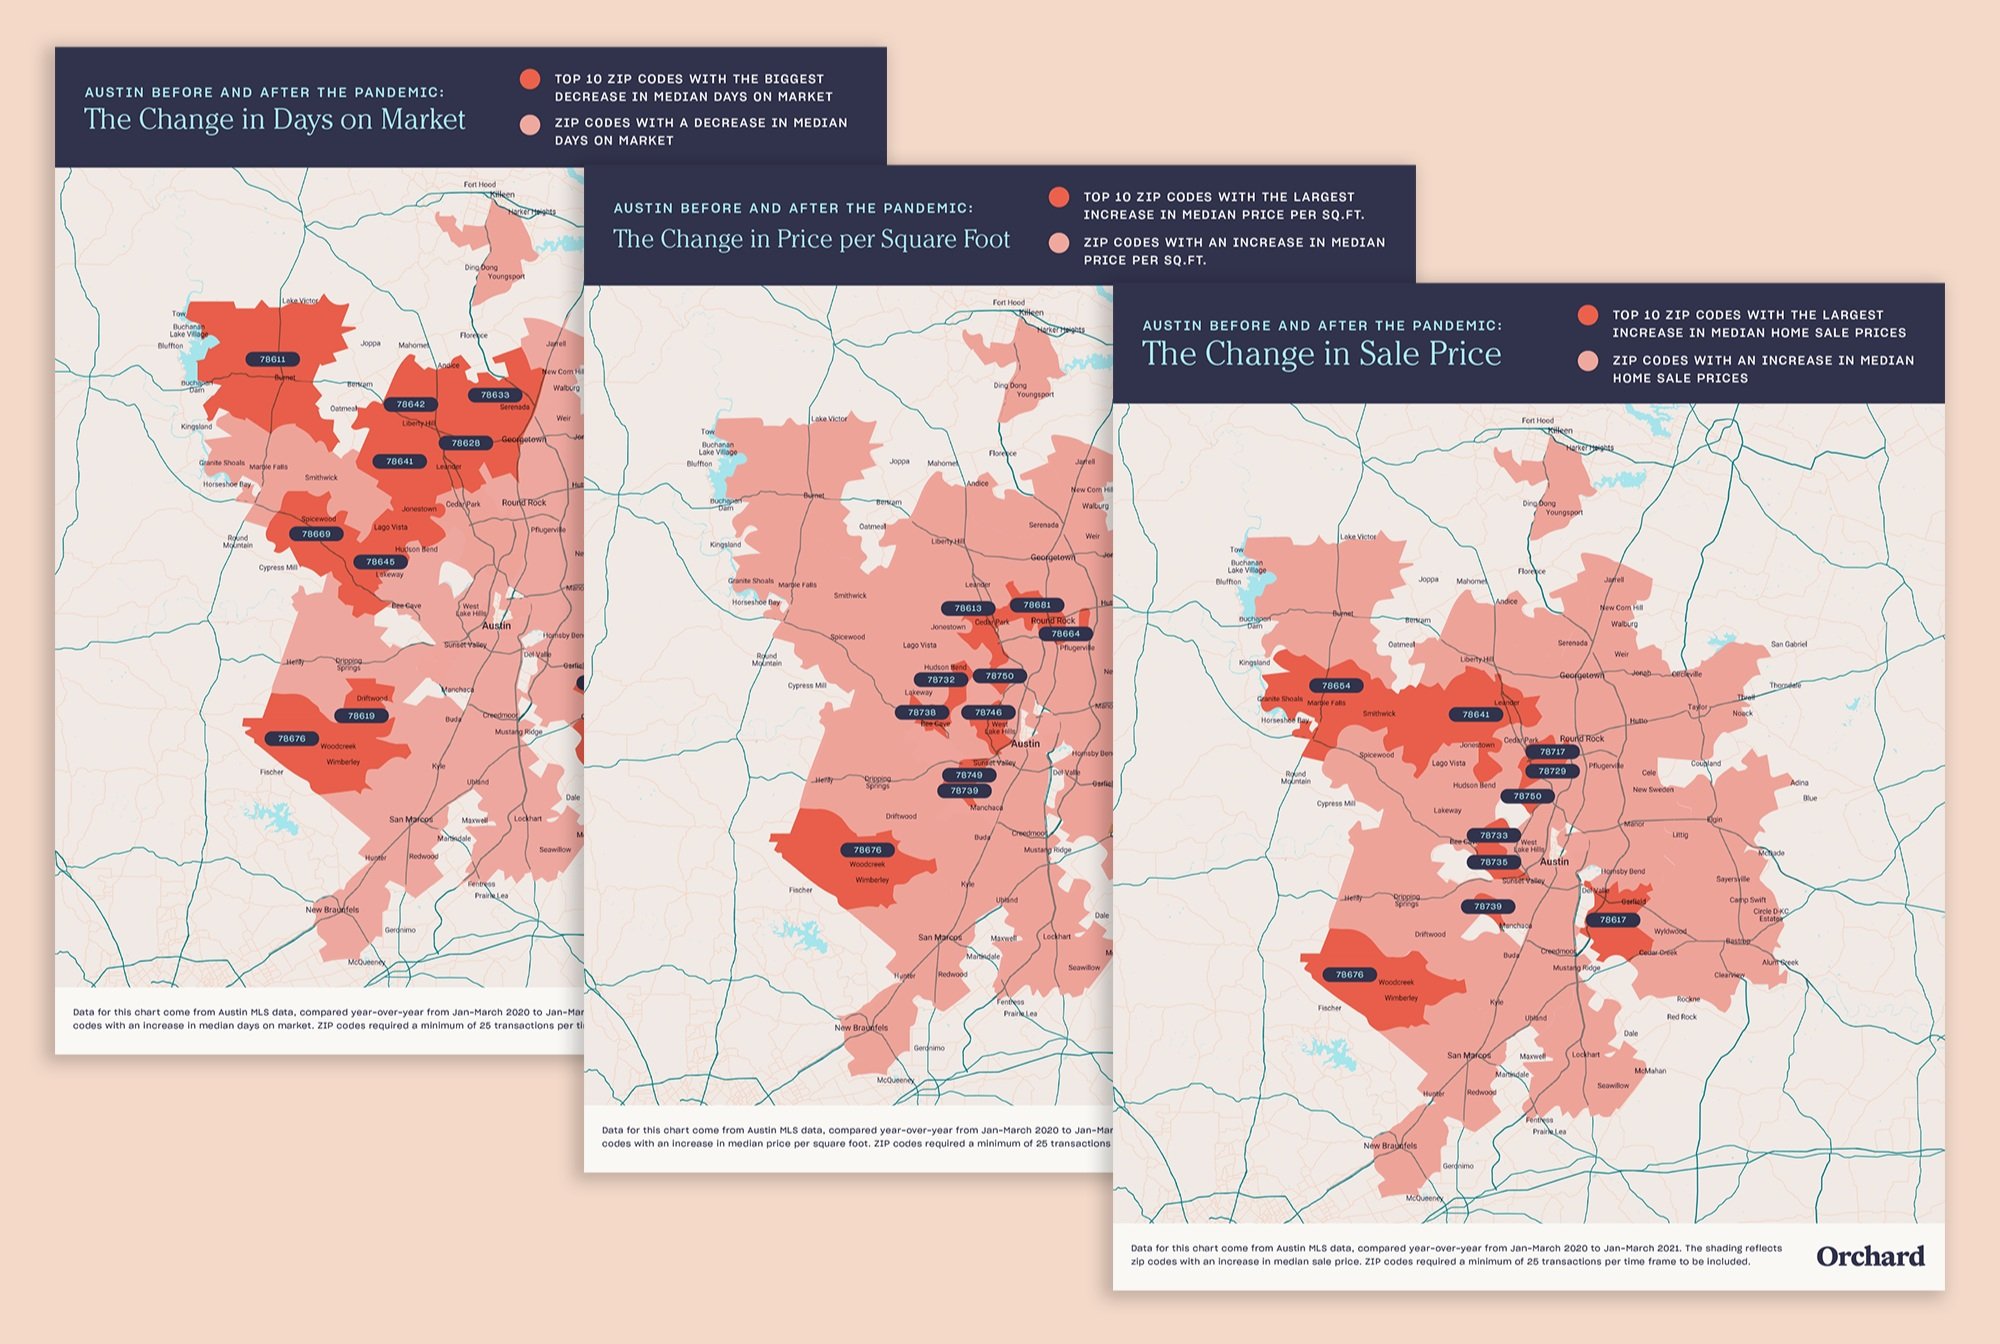
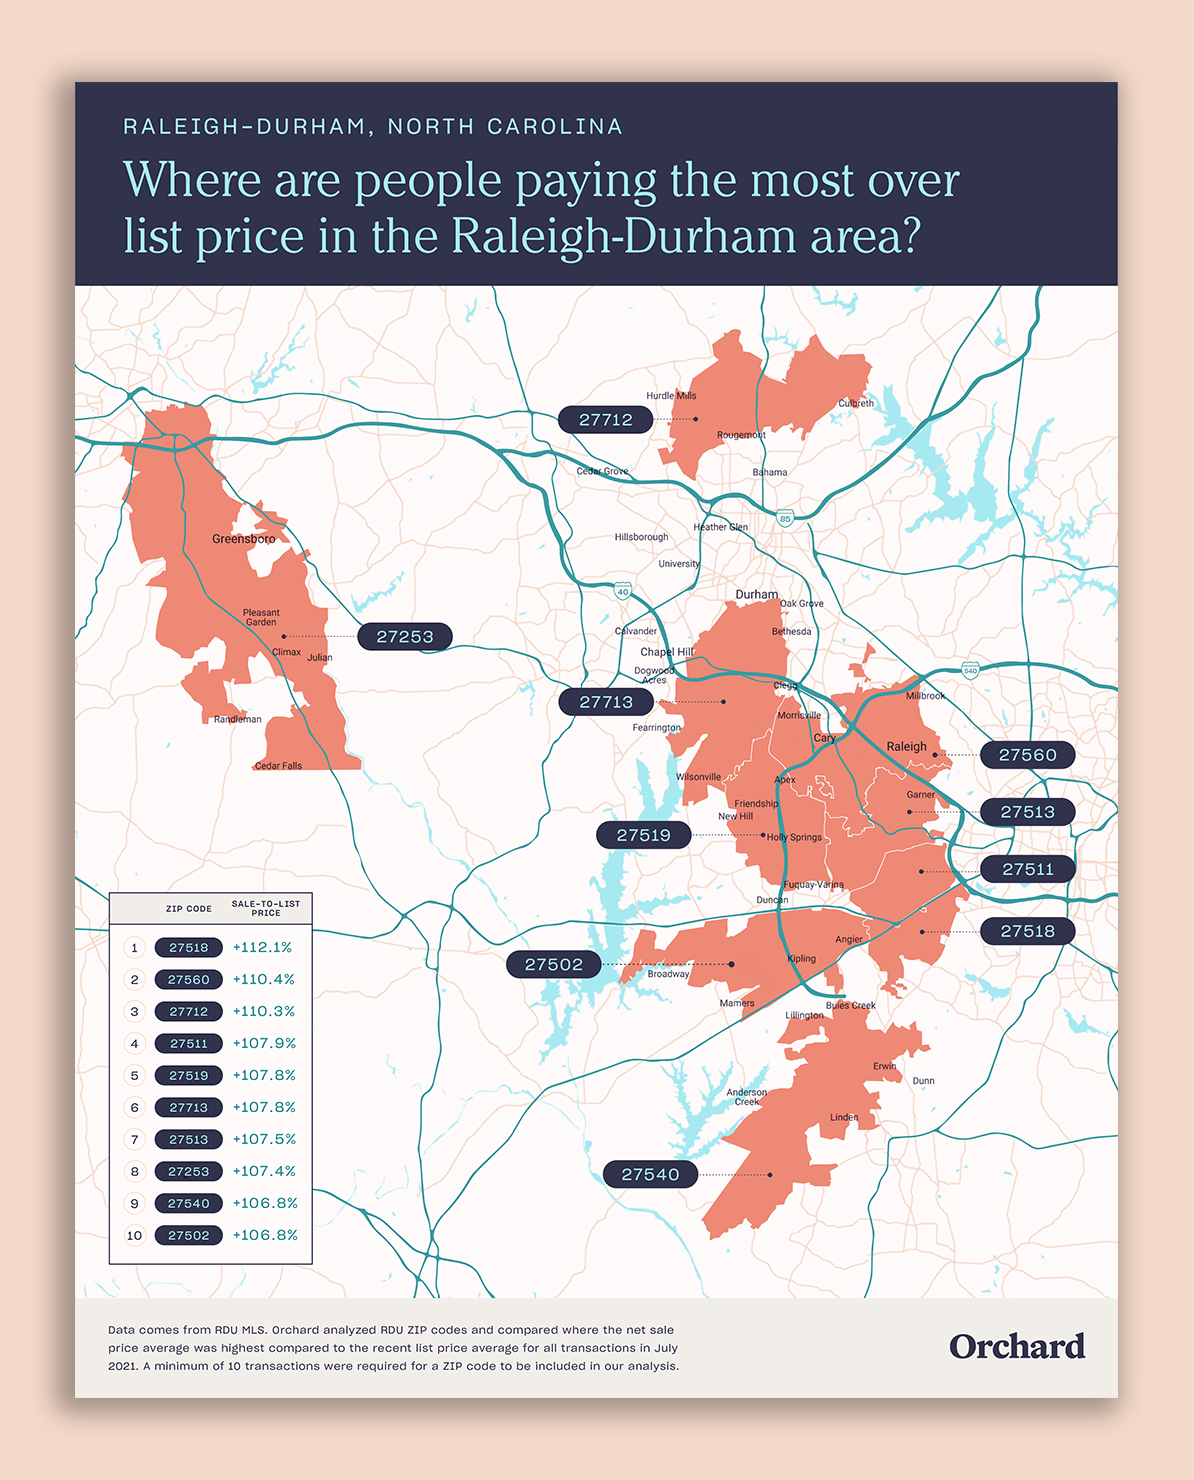
Orchard produces monthly data reports to shed light on market trends in the cities they operate in. My role was to figure out how best to visually display this data. I started by hacking the maps together to match our branding (Austin Data Report). After determining that this was going to be a routine project, I sourced and managed onboarding for a map tool that streamlined the process and allowed for interactive maps on our site (Atlanta Data Report).
ORCHARD | MAY 2021 - SEPT 2021


ATLANTA AFTER THE PANDEMIC
September 2021 | Read the full Atlanta data report and use the interactive maps here

